
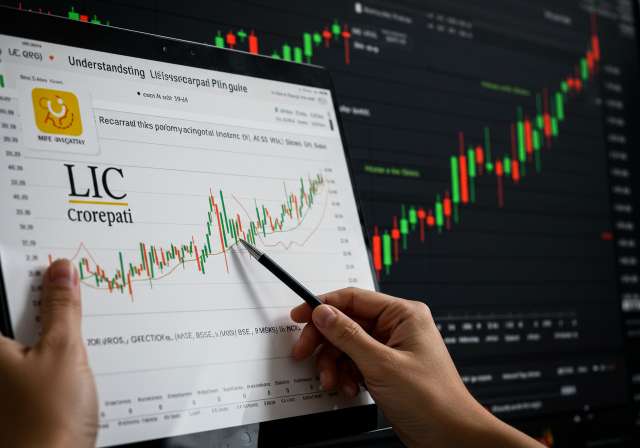
Unlock trading success on NSE/BSE! Discover the best technical analysis tools in trading apps tailored for Indian investors. Master candlesticks, MAs, RSI, a…
Namaste, fellow investors and traders! In the dynamic world of Indian stock markets, where the Nifty and Sensex fluctuate with every global breeze and local policy announcement, navigating the tides can feel like a Herculean task. Whether you’re a seasoned intraday trader or a careful swing investor, the quest for an edge is perpetual. This is where technical analysis, the study of historical price and volume data to predict future market movements, steps in. And thankfully, with the advent of sophisticated mobile and web-based trading apps, these powerful tools are now literally at your fingertips. Today, we’re diving deep into identifying the best technical analysis tools in trading app platforms that can truly empower your journey in the Indian equity markets.
The Indian financial landscape has undergone a remarkable transformation over the past decade. From the bustling trading floors to the quiet comfort of your smartphone, accessing the BSE and NSE has never been easier. Platforms like Zerodha Kite, Upstox, Groww, Angel One, and ICICI Direct have democratized trading, bringing millions of new retail investors into the fold. But simply having access isn’t enough; informed decision-making is key. This is precisely where a robust understanding and effective application of technical analysis tools become invaluable.
Why Technical Analysis is Your Ally in the Indian Market
Imagine you’re tracking a stock like Reliance Industries or an index like Bank Nifty. Fundamental analysis provides you with insights into the company’s health, economic outlook, and industry trends. Technical analysis, on the other hand, gives you a microscopic view of market sentiment, supply and demand dynamics, and potential entry or exit points. It’s like having a detailed weather map before venturing into the open sea of the stock market.
For Indian traders, technical analysis is particularly relevant due to several factors:
- Volatility: Indian markets can be quite volatile, offering frequent short-term trading opportunities. Technical tools help identify these setups.
- Demographics: A large percentage of retail investors in India engage in short-to-medium term trading, where technicals often dictate decisions.
- Accessibility: Most trading apps regulated by SEBI offer comprehensive charting and analysis tools, making TA accessible to everyone from a beginner to an expert.
- Liquidity: Major stocks and indices on NSE/BSE have high liquidity, ensuring that technical patterns are often respected.
So, what are the cornerstone technical analysis tools that you should look for and master within your chosen trading app?
Core Technical Analysis Tools Integrated into Modern Trading Apps
Modern trading apps are powerhouses of information, providing real-time data feeds directly from the NSE and BSE, coupled with a suite of analytical instruments. Let’s break down the essential tools.
1. Advanced Charting Capabilities: The Visual Foundation
At the heart of all technical analysis lies the chart. The effectiveness of your analysis often begins with the quality and versatility of your charting interface. Look for apps that offer:
- Candlestick Charts: These are by far the most popular chart types among Indian traders. They visually represent the open, high, low, and close prices for a specific period (e.g., 5-minute, daily, weekly). Their patterns (e.g., Doji, Hammer, Engulfing patterns) are crucial for understanding immediate market sentiment.
- Bar Charts: Similar to candlesticks but often less visually intuitive for beginners. They show the same price points (OHLC).
- Line Charts: Simplest form, connecting only the closing prices. Useful for identifying broad trends but lack detailed price action.
- Timeframes: The best technical analysis tools in trading app platforms offer a wide range of timeframes – from 1-minute to monthly – allowing traders to zoom in on intraday movements or zoom out for long-term trends.
2. Trend-Following Indicators: Riding the Wave
These indicators help identify the direction and strength of a trend, crucial for swing traders and position traders. They are fundamental in any list of the best technical analysis tools in trading app.
a. Moving Averages (MAs)
Moving Averages smooth out price data over a period to show the average price, thereby indicating the trend.
- Simple Moving Average (SMA): Calculates the average price over a specific number of periods.
- Exponential Moving Average (EMA): Gives more weight to recent prices, making it more responsive to new information.
Commonly used MAs in India include 9-period, 20-period, 50-period, and 200-period MAs. Traders often look for crossovers (e.g., 50-day EMA crossing above 200-day EMA, known as a “Golden Cross,” or below, a “Death Cross”) as buy or sell signals. These are fundamental for navigating Nifty and Bank Nifty movements.
b. Moving Average Convergence Divergence (MACD)
The MACD indicator reveals changes in the strength, direction, momentum, and duration of a trend. It’s calculated by subtracting the 26-period EMA from the 12-period EMA. A 9-period EMA of the MACD (the “signal line”) is then plotted on top, functioning as a trigger for buy and sell signals. When the MACD line crosses above the signal line, it’s a bullish signal; when it crosses below, it’s bearish. It’s an excellent tool to find momentum shifts early.
c. Bollinger Bands
Developed by John Bollinger, these bands consist of a middle band (typically a 20-period SMA) and two outer bands (usually two standard deviations away from the SMA). Bollinger Bands measure volatility and can help identify overbought or oversold conditions. When the bands contract, it often signals low volatility and potential for a breakout. When prices hit the upper band, it might be overbought; hitting the lower band suggests oversold conditions. A great tool for F&O traders looking for volatility plays.
3. Oscillators: Measuring Momentum and Overbought/Oversold Conditions
Oscillators fluctuate between a set range (e.g., 0-100) and are particularly useful for identifying potential reversals or measuring the speed and change of price movements. These are critical components of the best technical analysis tools in trading app for active traders.
a. Relative Strength Index (RSI)
The RSI is arguably one of the most popular oscillators among Indian traders. It measures the speed and change of price movements. It oscillates between 0 and 100. Traditionally, an RSI reading above 70 indicates that an asset is overbought (potentially due for a correction), while a reading below 30 suggests it is oversold (potentially due for a rebound). Divergences between price and RSI can also signal impending reversals.
b. Stochastic Oscillator
Similar to RSI, the Stochastic Oscillator compares a stock’s closing price to its price range over a given period. It’s based on the premise that in an uptrend, prices tend to close near their high, and in a downtrend, they tend to close near their low. Readings above 80 are generally considered overbought, and below 20 are oversold. It often consists of two lines, %K and %D, and crossovers provide trading signals.
c. Average Directional Index (ADX)
The ADX is a trend strength indicator, not a directional one. It typically ranges from 0 to 100. A reading above 25 generally indicates a strong trend (either up or down), while a reading below 20-25 suggests a weak or non-trending market. It is often plotted with two other lines, the Positive Directional Indicator (+DI) and Negative Directional Indicator (-DI), which indicate the direction of the trend. ADX is invaluable for confirming the strength of a trend identified by other indicators.
4. Drawing Tools: Customizing Your Analysis
No technical analysis is complete without the ability to manually mark up your charts. The best technical analysis tools in trading app platforms offer a robust suite of drawing functionalities:
- Support and Resistance Levels: These are fundamental. Support is a price level where a downtrend can be expected to pause due to a concentration of demand. Resistance is a price level where an uptrend can be expected to pause due to a concentration of supply. Drawing these accurately helps identify potential turning points.
- Trend Lines: These lines connect a series of higher lows (uptrend line) or lower highs (downtrend line), visually representing the direction and slope of a trend. Breaks of trend lines are often significant signals.
- Fibonacci Retracements: Based on the Fibonacci sequence, these horizontal lines indicate potential support and resistance levels where the price might retrace before continuing its trend. Popular levels are 23.6%, 38.2%, 50%, 61.8%, and 78.6%. Many Indian traders swear by Fibonacci for precise entry and exit points.
- Channels: Parallel trend lines forming a channel can help define trading ranges.
- Annotations: The ability to add text or shapes to highlight specific price action or patterns for future reference.
5. Volume Indicators: Confirming Price Action
Volume provides crucial insight into the conviction behind price movements. A price move on high volume is generally more significant than one on low volume. Apps that offer reliable volume indicators are considered to have some of the best technical analysis tools in trading app.
- On-Balance Volume (OBV): OBV is a momentum indicator that relates volume to price change. It shows whether volume is flowing into or out of a security. A rising OBV typically confirms a rising price, while a divergence can signal a potential reversal.
- Volume at Price: Some advanced apps show volume distribution at different price levels, highlighting strong support/resistance zones based on where significant trading activity occurred.
6. Pattern Recognition Tools (Advanced)
While often requiring manual identification, some advanced trading apps are beginning to integrate automated pattern recognition for common chart patterns such as Head and Shoulders, Double Top/Bottom, Triangles, and Flags. These can act as useful alerts, though manual confirmation is always advised.
What to Look for in a Trading App for Technical Analysis
Beyond the individual tools, the overall functionality and user experience of your trading app play a monumental role. When choosing a platform that offers the best technical analysis tools in trading app, consider these features:
- Real-time Data & Low Latency: Critical for intraday trading. Your app should provide instant price feeds from NSE and BSE.
- Customization: The ability to customize chart layouts, indicator parameters, color schemes, and save templates.
- Indicator Library: A comprehensive selection of indicators, not just the basic ones.
- Drawing Tool Variety & Ease of Use: Intuitive drawing tools that are easy to apply and adjust.
- Alerts: Set price alerts, indicator-based alerts (e.g., RSI crosses 70), or pattern-based alerts to never miss an opportunity.
- Backtesting Capabilities: (For advanced users) The ability to test trading strategies against historical data.
- Seamless Order Placement: The ability to place buy/sell orders directly from the chart, with features like bracket orders (BO) and cover orders (CO) for risk management.
- Multi-Device Synchronization: Your analysis should sync across mobile, web, and desktop platforms.
- User Interface (UI) & User Experience (UX): An uncluttered, intuitive interface that makes analysis enjoyable, not cumbersome.
- Cost & Brokerage: While not directly a TA tool, factor in brokerage charges (e.g., flat fee brokers vs. percentage-based) and annual maintenance charges (AMC).
- Educational Resources: Some apps offer tutorials or webinars on how to use their TA tools effectively.
- SEBI Compliance & Security: Ensure the app is registered with SEBI and follows stringent security protocols to protect your investments and data.
Popular Indian Trading Apps and Their TA Prowess
Most leading Indian broking apps today offer a respectable suite of technical analysis tools. While I cannot endorse any specific app, here’s what to generally expect:
- Zerodha Kite: Known for its clean interface and comprehensive charting powered by TradingView. It offers a vast array of indicators and drawing tools, making it a favorite for many active traders.
- Upstox Pro: Another popular discount broker with robust charting and analytical features, also often powered by industry-leading charting libraries.
- Groww: Initially known for mutual funds, Groww has expanded into stocks and offers decent charting tools, constantly improving its technical analysis offerings.
- Angel One (Angel Broking): A full-service broker that has significantly upgraded its digital platforms, providing advanced charting and research tools.
- ICICI Direct, HDFC Sky, SBI Securities: Traditional bank-backed brokers have also invested heavily in their digital platforms, providing competitive charting and analytical capabilities for their customers.
Before committing to an app, explore its demo versions or free accounts to assess the quality and depth of its technical analysis tools. Check if it truly offers the best technical analysis tools in trading app as per your individual needs.
Beyond the Tools: The Trader’s Mindset
While having the best technical analysis tools in your trading app is undoubtedly beneficial, remember that tools are only as good as the hand that wields them. Here are a few critical reminders for every Indian trader:
- Continuous Learning: The markets evolve, and so should your understanding. Keep learning about new indicators, patterns, and strategies.
- Risk Management: No tool guarantees 100% accuracy. Always define your stop-losses and position sizing. Even a small capital of ₹5,000 can be grown with disciplined risk management, whereas a large capital of ₹5 lakhs can be wiped out without it.
- Discipline and Patience: Adhere to your trading plan. Don’t chase trades. Wait for your setups to form.
- Backtest and Paper Trade: Before deploying real capital, test your strategies on historical data or via paper trading.
- Combine Analysis: For more robust decisions, consider combining technical analysis with fundamental insights, especially for longer-term investments.
- Emotional Control: Fear and greed are the biggest enemies of a trader. Technical tools help provide objective decision points, but adhering to them requires emotional discipline.
SEBI, our market regulator, constantly works towards investor protection. They emphasize informed decision-making and caution against speculative trading without proper research and risk assessment. Technical analysis, when used judiciously, forms a strong pillar of informed decision-making.
Conclusion: Empower Your Trading Journey
In the vibrant and complex Indian stock market, equipping yourself with the right knowledge and tools is paramount. The journey to becoming a successful trader or investor is a marathon, not a sprint. By understanding and effectively utilizing the best technical analysis tools in trading app platforms available today, you can gain a significant edge.
From mastering candlestick patterns and interpreting Moving Averages to identifying overbought conditions with RSI and confirming trends with ADX, these tools provide a structured approach to market analysis. Choose an app that not only offers these powerful features but also presents them in an intuitive, real-time, and customizable manner.
Remember, while the tools enhance your vision, your discipline, learning, and risk management are the compass and map that truly guide you to your financial goals. Happy trading, and may your charts always be in your favour!


Leave a Reply